OSM - the base map format for this project
Introduction
In this project we are goint to use OSM format maps, because they are open source and have good support. There are multiple different types of ways to format an OSM map. We have chosen to use .osm files for formating and as a data source. With mapping, its important to have a tool to visualize the documents to cross check that everything is correct. To our knowledge Qgis is the most used tool for that, so we are basing our project on qgis, however as OSM is a widespread format if necessary its also possible to you use other tools to process analyse the maps.
Intorductory tutorial about coordinate systems
A coordinate system can be
- projected - coordinates in northin, easting. Example HK1980 Grid - The accidents file is in this format. These are coordinates converted to a flat paper kind of surface
- spherical - coordinates in longitude, latitude. Example wgs84. Coordinates on the sphere.
To convert files in HK 1980 coordinate to wgs1984 you can use this site. https://www.geodetic.gov.hk/smo/en/tform/tform.aspx
References
- Good intro pdf
- Hk grid system info
- https://www.geodetic.gov.hk/smo/en/tform/tform.aspx
OSM
The cornestone of OSM are
- Nodes
- Ways
Nodes carry the geographic coordinates in the OSM data model. A way only gets geometry via the nodes that are members of it. Most of the time such nodes will be untagged and only serve to determine the way geometry. There are also nodes with tags, these show points of interests.
You can extract OSM maps for different locations from. https://mapzen.com/documentation/metro-extracts/tutorial/
Analysis have been currently based on this file
References
- http://en.flossmanuals.net/openstreetmap/the-osm-data-model/
- http://wiki.openstreetmap.org/wiki/Node
QGIS
How to open a file with .osm extension in qgis
Option A
In the left sidebar go to the folder where .osm file is located at. Double click on it. In the opening window click on “choose all” and then click okay. The file will be opened fully. with bigger sets, this could take time. Overall, opening full Hong Kong data for example renders very slow.
Option B Sqlite Database
In menu click:
- Vector
- OpenStreetMap
- Import Topology from XML -> choose osm file u waant to use. Then Import database
then
- Vector
- OpenStreetMap
- Export Topology to SpatialLite
- Choose polylines, lines or points
- Click on load
- Choose Features -> NOT NULL SECTOR IN TABLE MEANS FILTERING
If gives error, it might not import all data.
Import from csv
http://www.qgistutorials.com/en/docs/importing_spreadsheets_csv.html
Grouping and Colouring of Nodes
PS - to show node in QGIS you have to add a tag to it. Otherwise this node is only considered a way node and wont be visualized.
https://gis.stackexchange.com/questions/20404/how-to-give-multiple-colors-to-features-within-a-single-shapefile
tags for grouping nodes
- If you want to visualized real values like OMS with qgis, you have to generate double value features inside qgis.
Roads Under Analysis for this Project
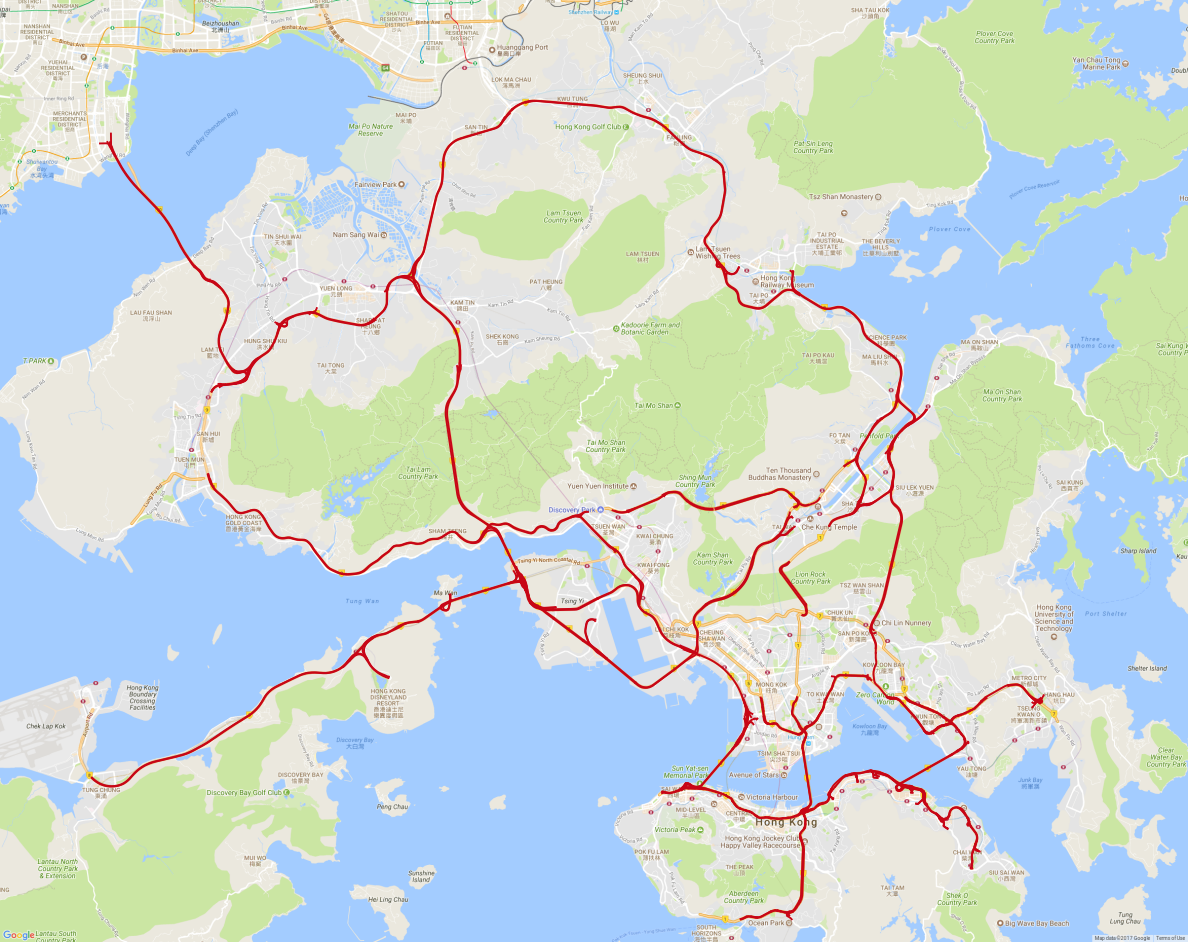
As mentioned before, nodes and ways can both contain specific tags with information. For this project only certain ways and nodes were needed. More specifically, nodes and ways which stood as roads were chosen. These roads were also filtered so only roads with the OSM tag trunk and motorway were kept. Such a choice was made because these tags specify most important roads in a country’s system and are likely to produce the most data with the highest quality. For a developmental project this is a very important aspect because it allows to focus on other aspects like model development instead of trying to satisfy all conditions. This also allowed to include roads which are under the supervision of speedpanels. The roads that were finally chosen to be analysed can be seen on the figure below. The ways (roads) have only one direction. To perform the filtering of the roads a Java-based geospatial tool JOSM was used.
OSM parser
To make the visualisation of the geospatial data easier, a static class called \path{bgt.parsing.OSMparser} was created. This parser is capable of transforming most of the intermediate data that is generated in the preprocessing phase into visualisable OSM format. For example GPS records from taxis and accidents, trajectories, speedpanel location data and detection rate can be and are visualised with this class in the later phases of this project. This parser serves as a project on its own and could be used separately to visualise geospatial data.
Leave a Comment